I have never seen a plant save real money through an awareness campaign. I have seen it through measurement: a network analyser left on each important feeder for a few days, a sub-meter on the air compressor, and an honest spreadsheet. Guesswork is the most expensive method there is, because it puts capital in the wrong place and convinces the team that efficiency does not work.
The audit starts with data you already have
Before buying instruments I ask for twelve months of bills, the hourly profile if the utility can provide it, the current contracted demand and the list of equipment with its nameplate. That package already tells a lot: it shows seasonality, it shows whether the problem is consumption (kWh) or demand (kW), and it shows whether reactive excess is being charged. Only then do I go to the field to measure.
| What I collect | What it is for | Where it comes from |
|---|---|---|
| Twelve months of bills | Separate consumption from demand and see the tariff modality effect | Power bill and utility customer portal |
| Hourly load profile | Find the ramp that sets the monthly maximum demand | Network analyser or utility data |
| Active power, reactive power, PF | Check whether excess is charged and how much capacity is wasted | Analyser on the main board |
| Current per phase and harmonics | Detect imbalance and neutral heating | Analyser with THD logging |
| Connection temperatures | Find bad-contact loss before it becomes a shutdown | Thermal camera under load |
Peak hours, off-peak hours and contracted demand
Under a time-of-use tariff the same machine is expensive for two hours and cheap for the other twenty-two. The peak rate punishes kWh; contracted demand punishes the peak. Those are two different problems with two different solutions. Cutting kWh by shifting production out of peak is usually the cheapest item on the list. Renegotiating contracted demand is the highest-impact one when the plant runs close to its limit all month.
- Plot the monthly load profile and mark the exact hour maximum demand happened;
- Check whether that peak came from one large start, three simultaneous starts or badly sequenced steps;
- Consider deliberate start delays and interlocks for equipment that never needs to run together;
- Verify whether today's contracted demand still makes sense after shift and line changes.
Where the energy disappears inside the plant
Compressed air, the waste champion
A compressor is, comfortably, the worst end-use efficiency machine in the building: almost all the energy becomes heat and a fraction becomes work. So I start with three questions: what is the lowest pressure the most demanding equipment accepts, how much compressed air feeds blowers and vacuums that could be electric fans, and how many leaks are there. A hole of a few millimetres on an 8 bar line is a continuous loss nobody hears as a problem.
Pumps, fans and compressors
Flow machines follow a cubic relationship: trimming flow by 20% cuts far more than 20% of power. Where regulation happens by valve or damper, a variable-speed drive is waiting to be studied — with judgement, because a drive on a machine that works at a fixed duty point may not pay. Measure real current before and after; the nameplate does not tell the story.
Warehouse lighting
The LED swap usually pays, but the bigger gain comes from three adjustments: illuminance matched to the task, zoning with occupancy control in traffic areas, and cleaning. A dirty luminaire loses a large share of its flux, and LED drivers sitting in high ambient temperature shorten their own life.
Busbar and connection thermography
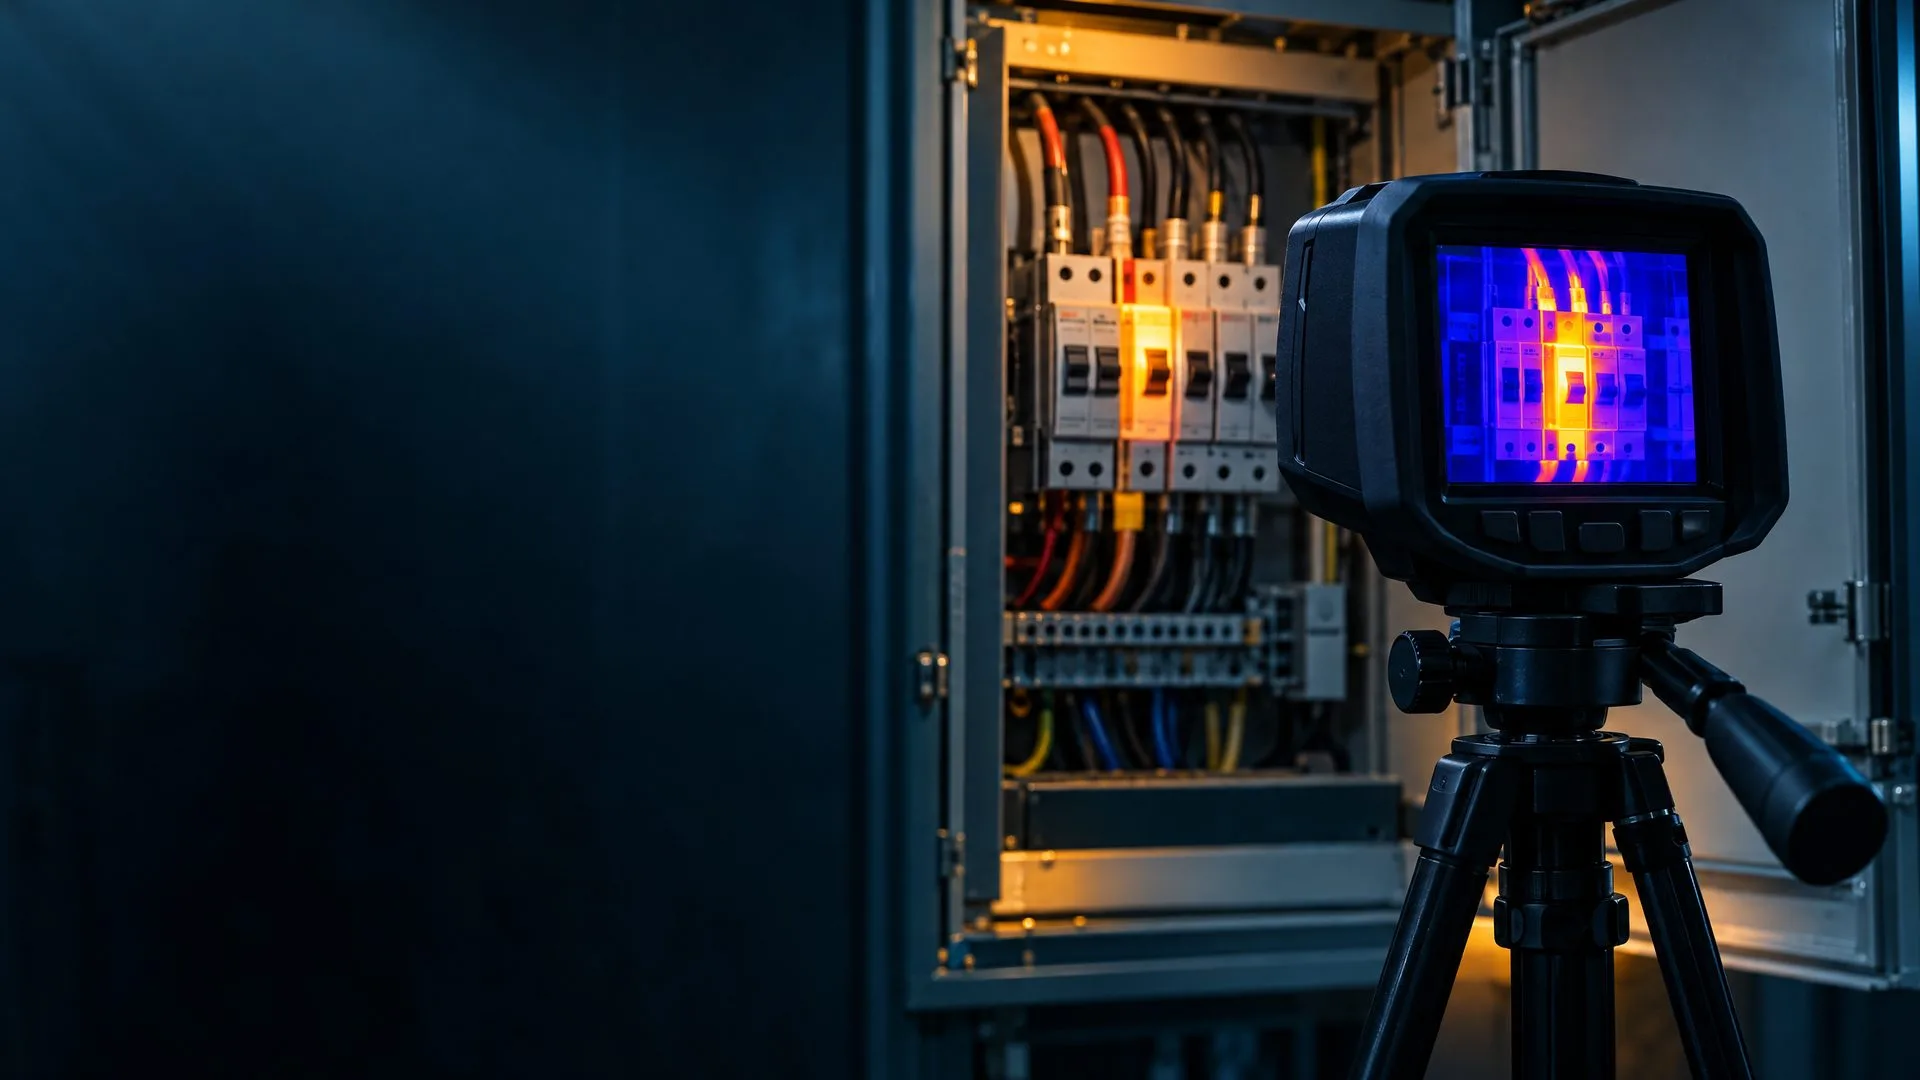
A busbar joint showing 20 K above its neighbours is converting money into heat every minute, and the risk is not the bill: it is the shutdown. A thermography report taken under representative load with the emissivity set correctly exists exactly for this — ranking retightening, connector replacement and rebalancing on evidence instead of instinct.
Sub-metering: measure by area to be able to act by area
Without per-area metering, the result of any action stays invisible: the utility delivers one monthly number mixing production, weather and shifts. Energy and demand meters on the main feeders, with time logging, give you three things: comparable production weeks, waste attributed to somebody who can fix it, and proof that the proposed measure worked. It is also what supports the energy-intensity indicator used in sustainability reporting.
Payback maths without makeup
Simple payback is investment divided by annual saving. That saving, however, must be avoided cost, not the memory of one good month. It is made of: kWh no longer bought at the real average tariff (taxes and tariff flag included), kW of avoided demand where it changes the contract, reduced maintenance and downtime where it is real, minus any extra consumption the solution itself adds — drives ventilate and heat, dryers regenerate longer, filters add pressure drop.
| Component | How it enters the calculation |
|---|---|
| Avoided kWh | Measured profile before and after, at the real tariff including taxes and flag |
| Avoided kW of demand | Only if the new peak lands below the contracted demand |
| Investment | Equipment, installation, production downtime and commissioning |
| Extra operating cost | More maintenance, auxiliary consumption, filtration, ventilation |
| Residual life of the old asset | If it was due for replacement anyway, the gain is smaller |
Mistakes I see most in savings requests
- Starting with the most visible item (lamps) instead of the largest measured load;
- Comparing different production weeks as if they were equivalent;
- Ignoring contracted demand and peak hours when estimating the gain;
- Buying drives without studying whether the machine runs at a fixed duty point;
- Keeping compressed-air pressure high because the process owner is afraid;
- Leaving production downtime out of the investment line;
- Not installing a meter afterwards, so the result cannot be proved.
Energy efficiency without metering is a religion: everybody prays, nobody proves. The instrument costs less than one week of waste.
If your plant still has no measured load profile, the first step is not buying equipment, it is diagnosis. It comes out of the same process as a technical report with thermography and power-quality analysis, and it ends in a list ranked by risk and by payback — the core of the energy savings page. How to commission it is on the quote form.
What to take away
- Consumption (kWh) and demand (kW) are separate problems: one is attacked with efficiency and shifting, the other with sequencing and contract renegotiation.
- Start with the largest measured load, not the most visible one: compressed air and flow machines respond before lighting does.
- Thermography under load is the only way to see contact loss hiding inside a busbar.
- Honest payback includes production downtime, extra operating cost and the residual life of the asset being replaced.
- Without a sub-meter after the action there is no proof — and the next efficiency budget gets refused.
Technical lead
Julio C. Fornazier
Leading Energia Criativa, Julio signs low and medium voltage electrical designs, technical inspection reports and energy efficiency plans for industrial, commercial, condominium and residential clients across Brazil. His method is simple: measure before specifying, simplify the circuit, cut waste and deliver the full documentation needed for utility approval, fire marshal audits and inspections.